Ace
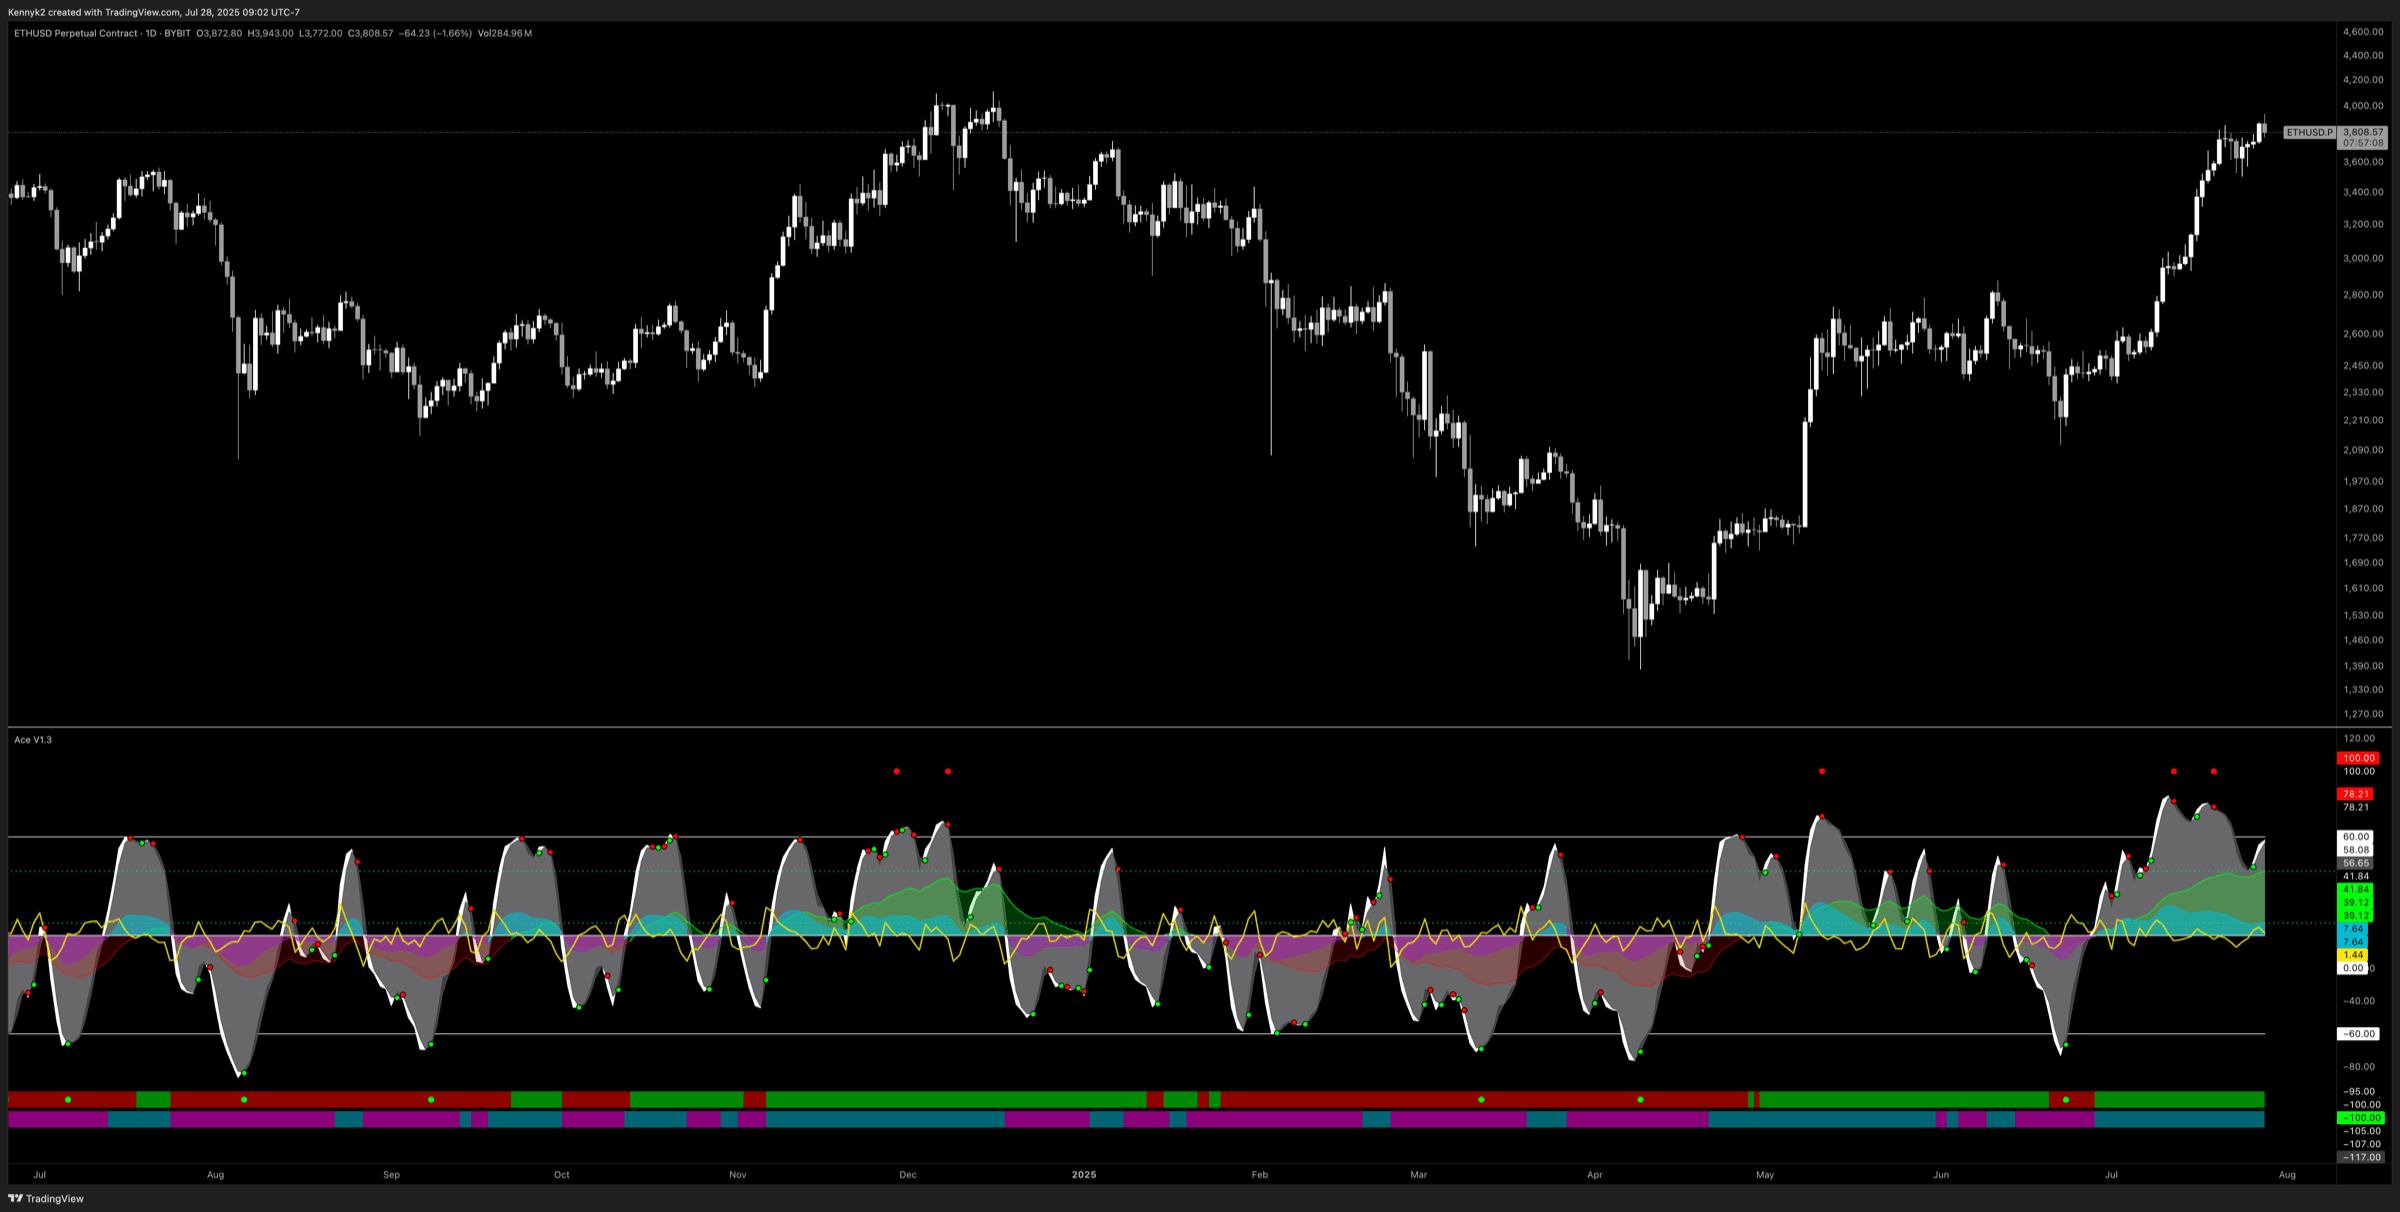
Money flow, momentum waves, signal dots, VWAP and the rebuilt Pressure engine in one pane. Built for reading context first and timing second.
Money flowWavesPressureDotsVWAP
Ace is a TradingView indicator that shows who's in control of a market. Money flow, momentum waves, pressure and signal dots, stacked on one screen. Any market TradingView charts. Any timeframe.
Each layer answers one question about the tape. The mini-charts below are live: the same BTC 1H feed as the monitor above, computed the way Ace computes it.
Is money moving in or out? A smoothed read of where price keeps closing against its recent average. Green above zero, red below.
Flow sets the side. A flip is an early warning, not an order.
A fast and a slow wave on a ±60 scale show how stretched a move is. The light sliver between them is momentum building or fading.
Past ±60 the move is stretched. Watch for the waves to curl back.
A small dot marks every wave cross. A big dot fires when that cross happens beyond ±60: exhaustion at an extreme.
Dots are timing. Take the ones that agree with the flow.
The waves' slope as a histogram. Bright bars mean thrust is building, faded bars mean it's dying.
Its zero cross is the earliest dot you'll get.
Candle bodies weighted by relative volume, smoothed by an adaptive Kalman filter. Shows who is actually pushing.
Cyan is buyers pressing, purple is sellers. Divergence from price is the tell.
Every plan includes both. Ace for the full read, Smooth when you want the trend and nothing else.
Money flow, momentum waves, signal dots, VWAP and the rebuilt Pressure engine in one pane. Built for reading context first and timing second.
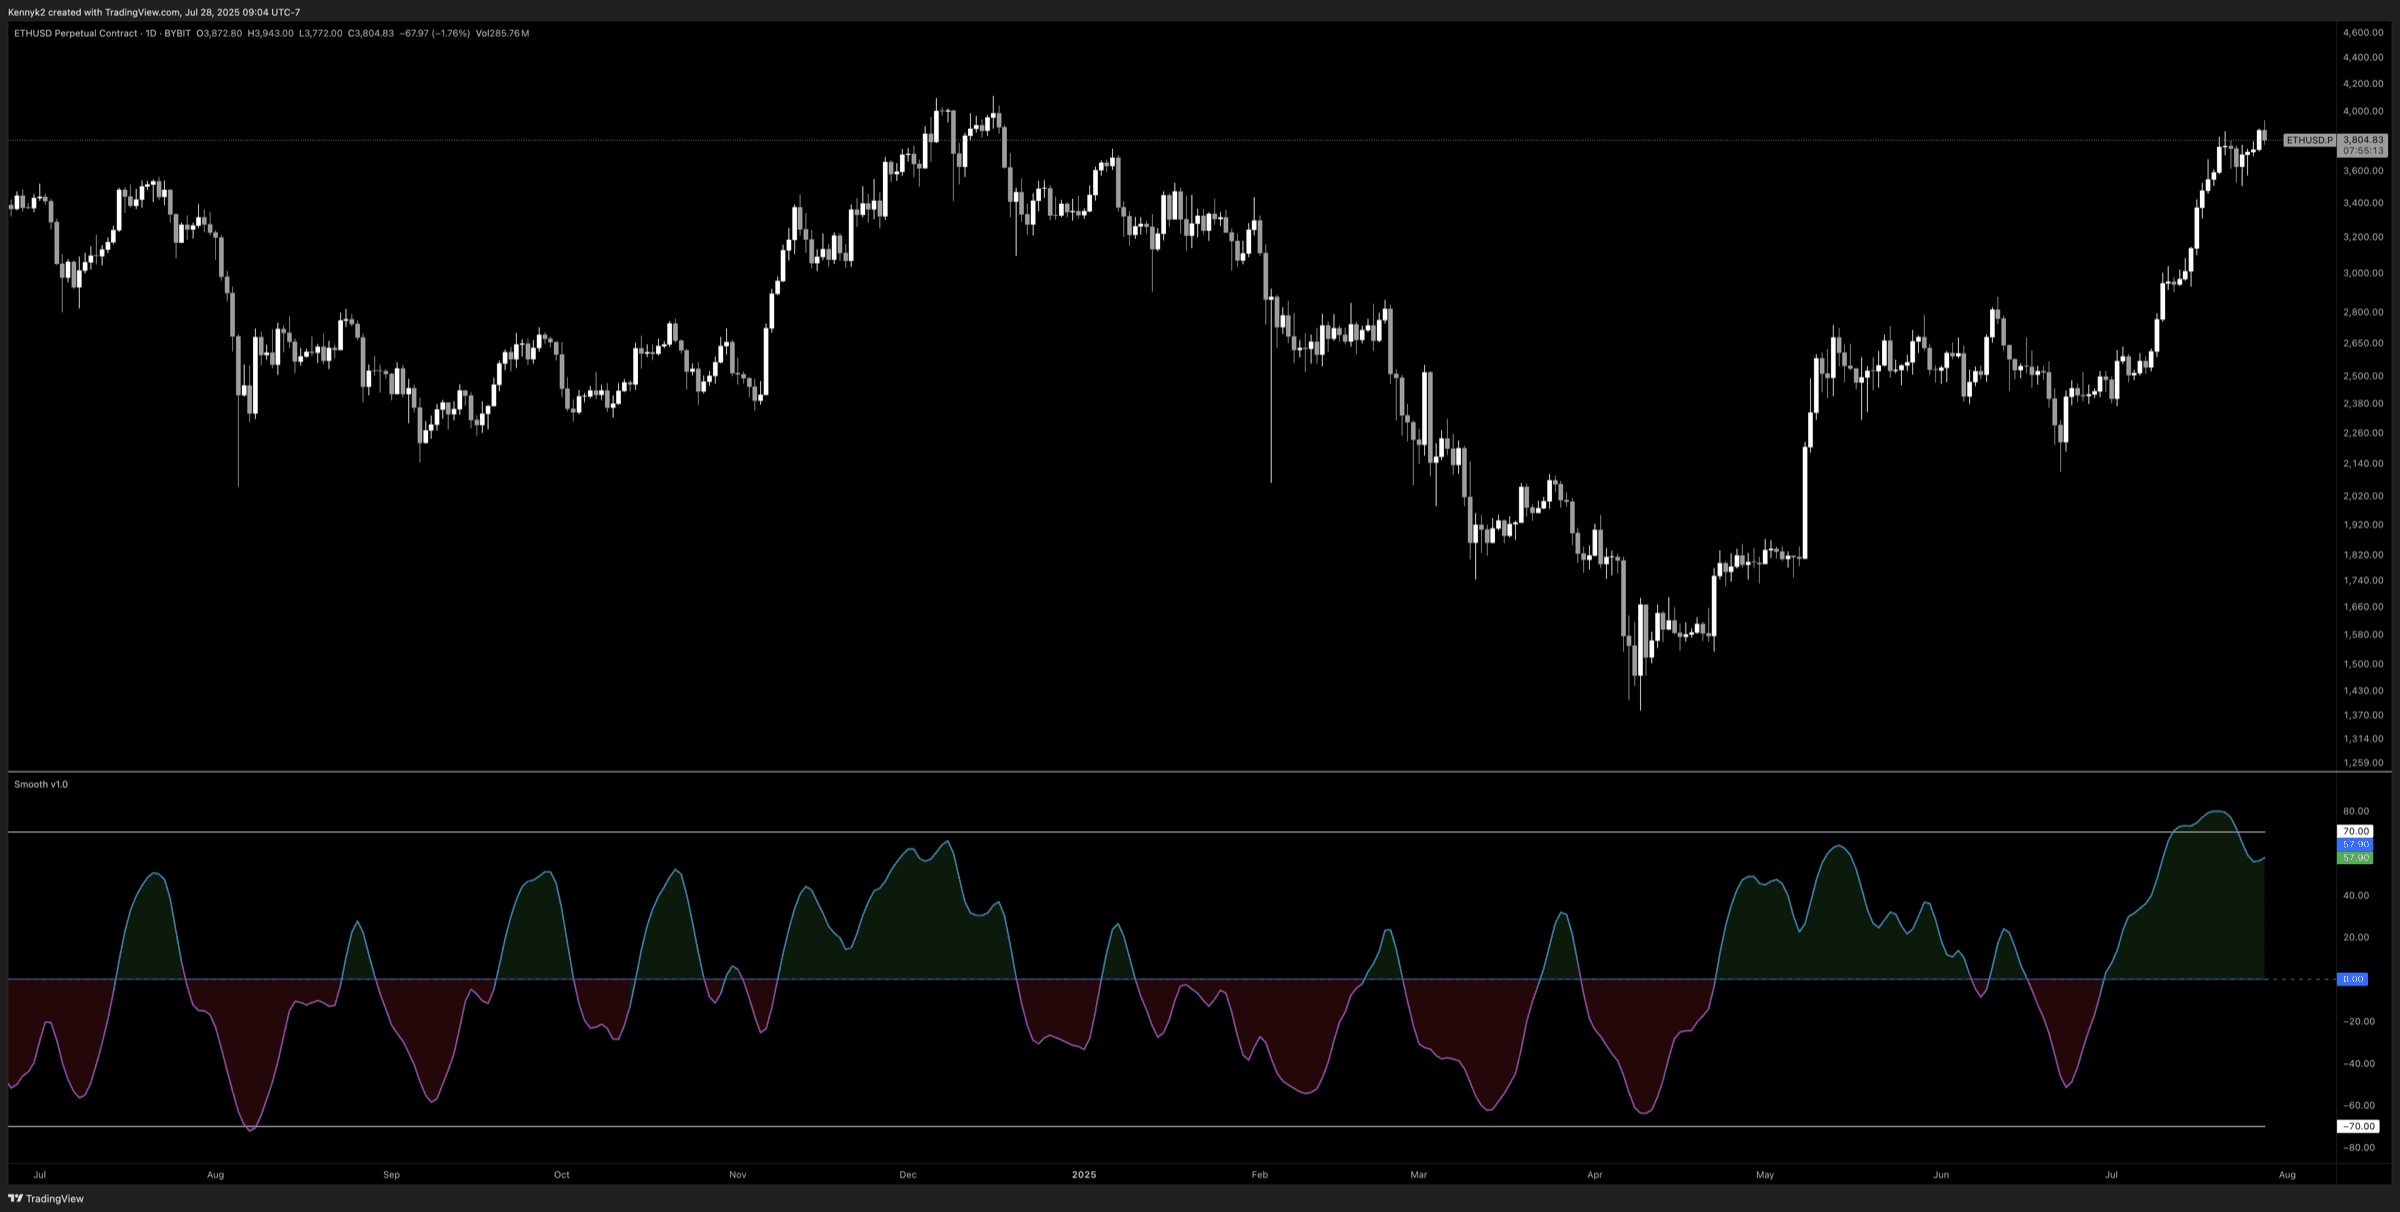
A clean wave model without the noise. One line, ±70 zones, green above zero and red below. The quiet partner to Ace.
Four steps from here to Ace on your charts.
Same indicators on every plan. The only difference is how long you keep them.
One month. Try the flow on your own charts.
Twelve months for the price of ten.
Pay once. Keep Ace for good.
INSERT COIN TO CONTINUE

Put Ace on your charts tonight. Read the flow first, then decide.
Is money moving in or out? A smoothed read of where price keeps closing against its recent average. Green above zero, red below.
Flow sets the side. A flip is an early warning, not an order.
A fast and a slow wave on a ±60 scale show how stretched a move is. The light sliver between them is momentum building or fading.
Past ±60 the move is stretched. Watch for the waves to curl back.
A small dot marks every wave cross. A big dot fires when that cross happens beyond ±60: exhaustion at an extreme.
Dots are timing. Take the ones that agree with the flow.
The waves' slope as a histogram. Bright bars mean thrust is building, faded bars mean it's dying.
Its zero cross is the earliest dot you'll get.
Candle bodies weighted by relative volume, smoothed by an adaptive Kalman filter. Shows who is actually pushing.
Cyan is buyers pressing, purple is sellers. Divergence from price is the tell.